▍EFK Stack
Настройка централизованного логирования в Docker с применением EFK Stack
За основу возьмём предыдущую статью, где использовался ELK. В данном случае будет использоваться Fluentd (сбор, фильтрация, парсинг логов, их буферизация и отправка на Elasticsearch) вместо Logstash.
Сборка Fluentd
Чтобы наш Fluentd мог взаимодействовать с Elasticsearch необходимо доустановить плагин fluent-plugin-elasticsearch для этого собирём свой конейнер.
FROM fluent/fluentd
RUN ["gem", "install", "fluent-plugin-elasticsearch", "--no-document"]
RUN ["gem", "install", "fluent-plugin-record-modifier", "--no-document"]
RUN ["gem", "install", "fluent-plugin-rewrite-tag-filter", "--no-document"]
Сборка:
Настройка Fluentd
version: '3.3'

services:
   fluentd:
        image: my/fluentd
        restart: always
        container_name: fluentd
        volumes:
          - /srv/docker/conf/fluentd:/fluentd/etc
        links:
          - "elasticsearch"
Конфиг:
<source>
  @type syslog
  port 5140
  bind 0.0.0.0
  tag syslog
</source>

<filter syslog.local7.info>
  @type parser
  key_name message
  <parse>
    @type json
    json_parser oj
  </parse>
</filter>

#<filter syslog.local7.err>
#  @type stdout
#</filter>

<match *.**>
  @type elasticsearch
  hosts https://elasticsearch:9200
  scheme https
  ssl_verify false
  ssl_version TLSv1_2
  port 9200
  user fluentd
  password PASSWORD
  logstash_format true
  logstash_prefix fluentd
  logstash_dateformat %Y.%m.%d
  include_tag_key true
  tag_key @log_name
  flush_interval 5s
</match>
Настройка авторизации Fluentd в Elasticsearch
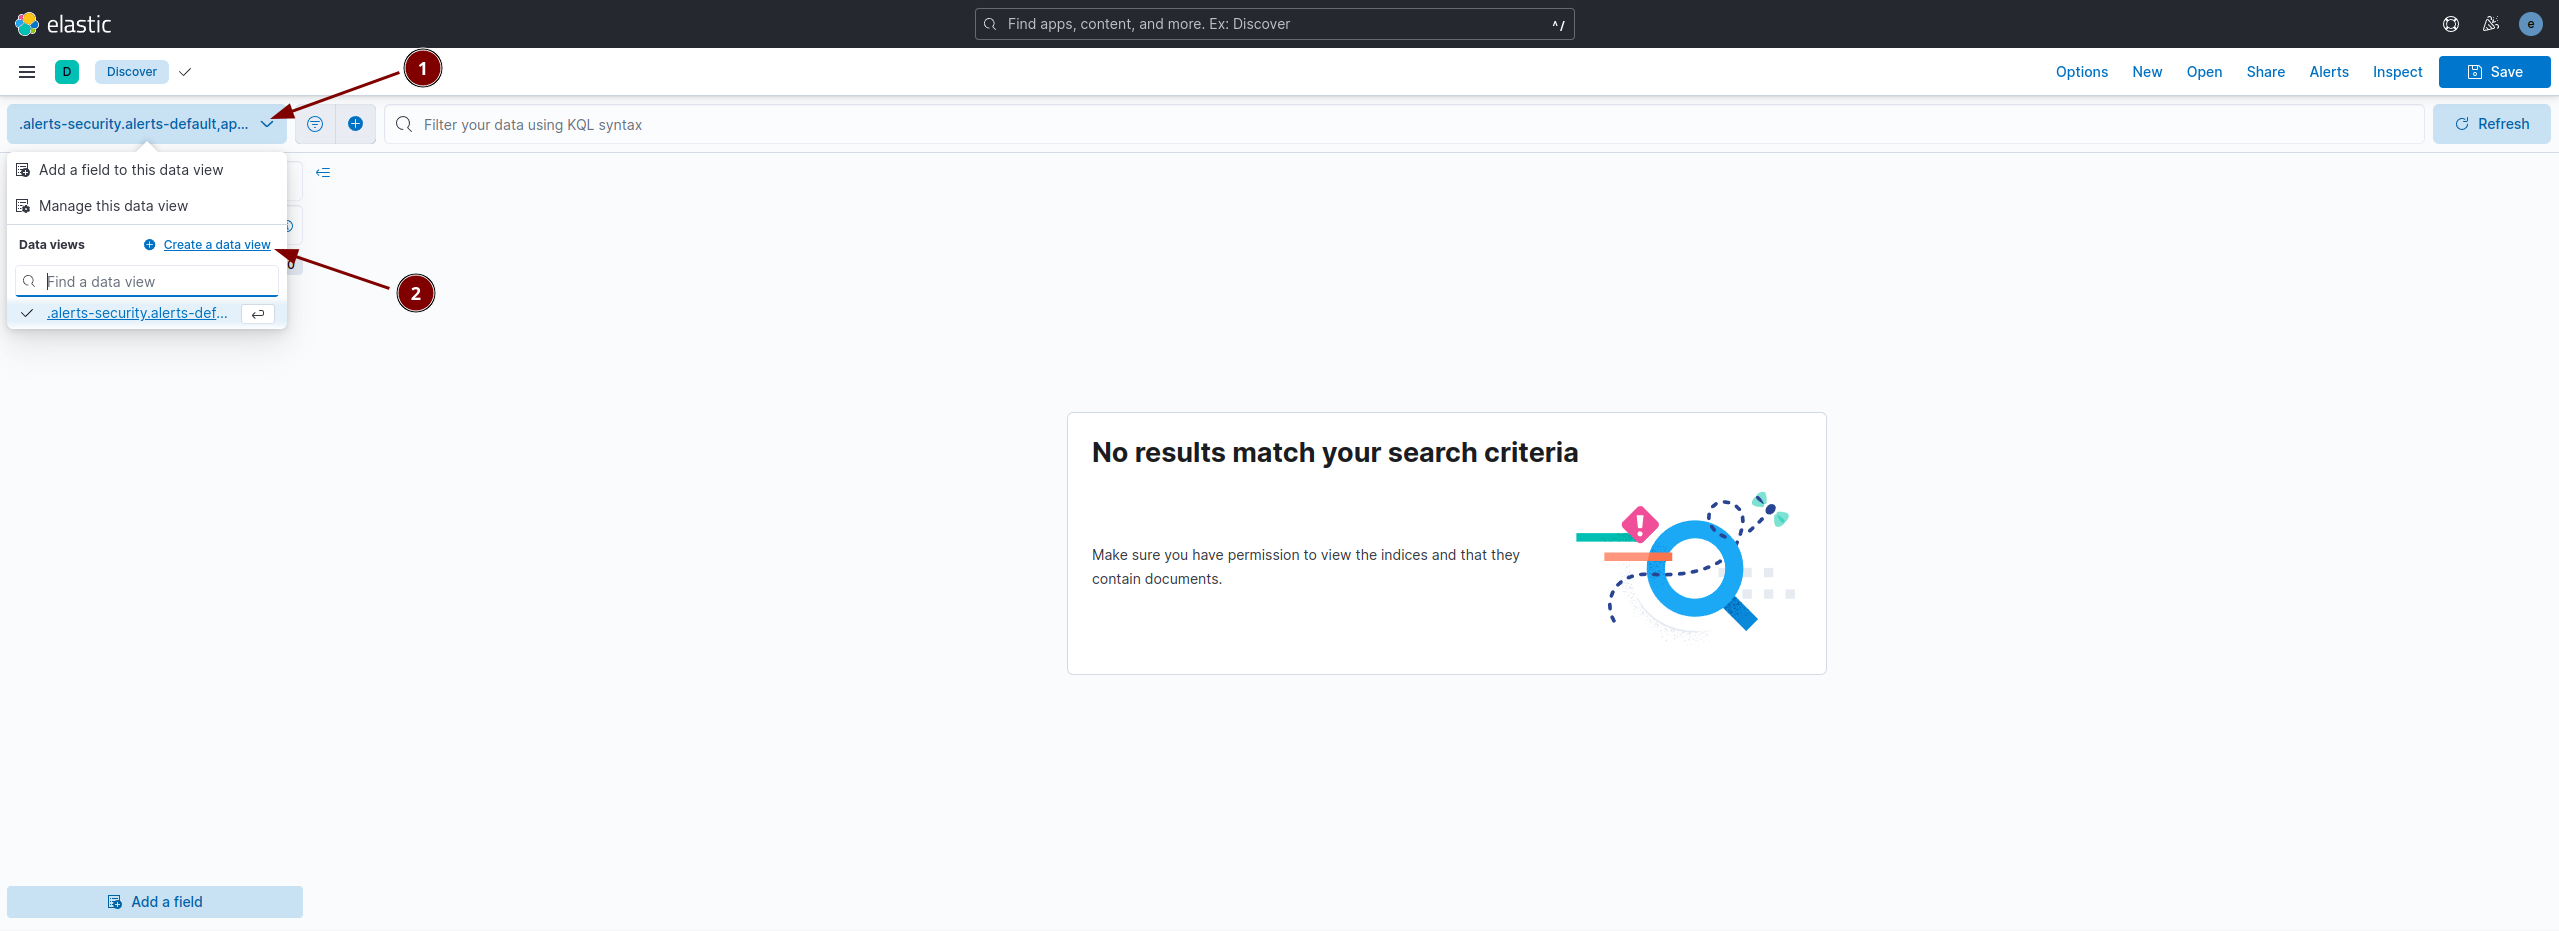
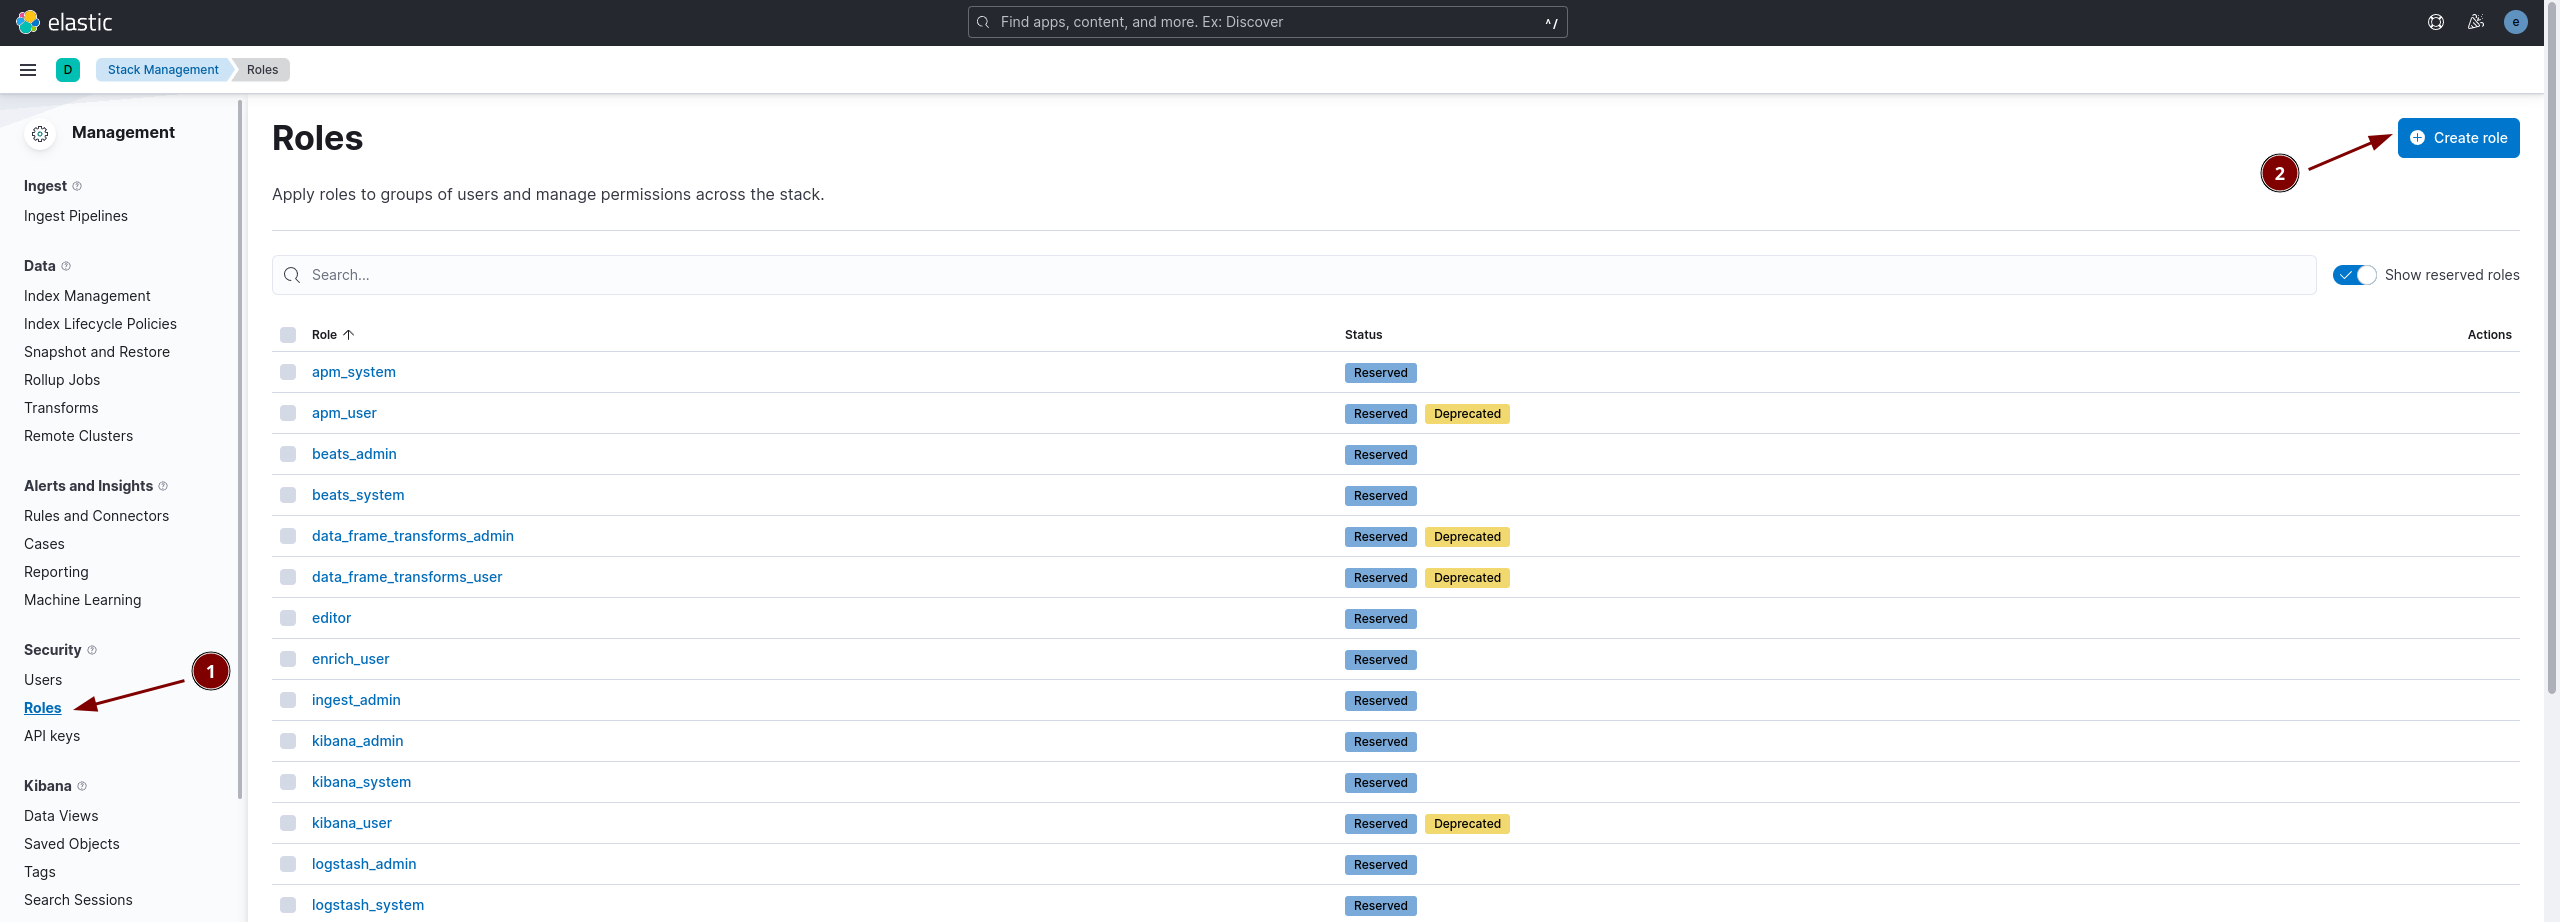
- Создаем роль с именем fluentd для пользователя fluentd, с которым fluentd-агент будет авторизовываться в Elasticsearch. Переходим в раздел Kibana->Management->Security->Role->Create role
Указываем данные как на скриншоте: 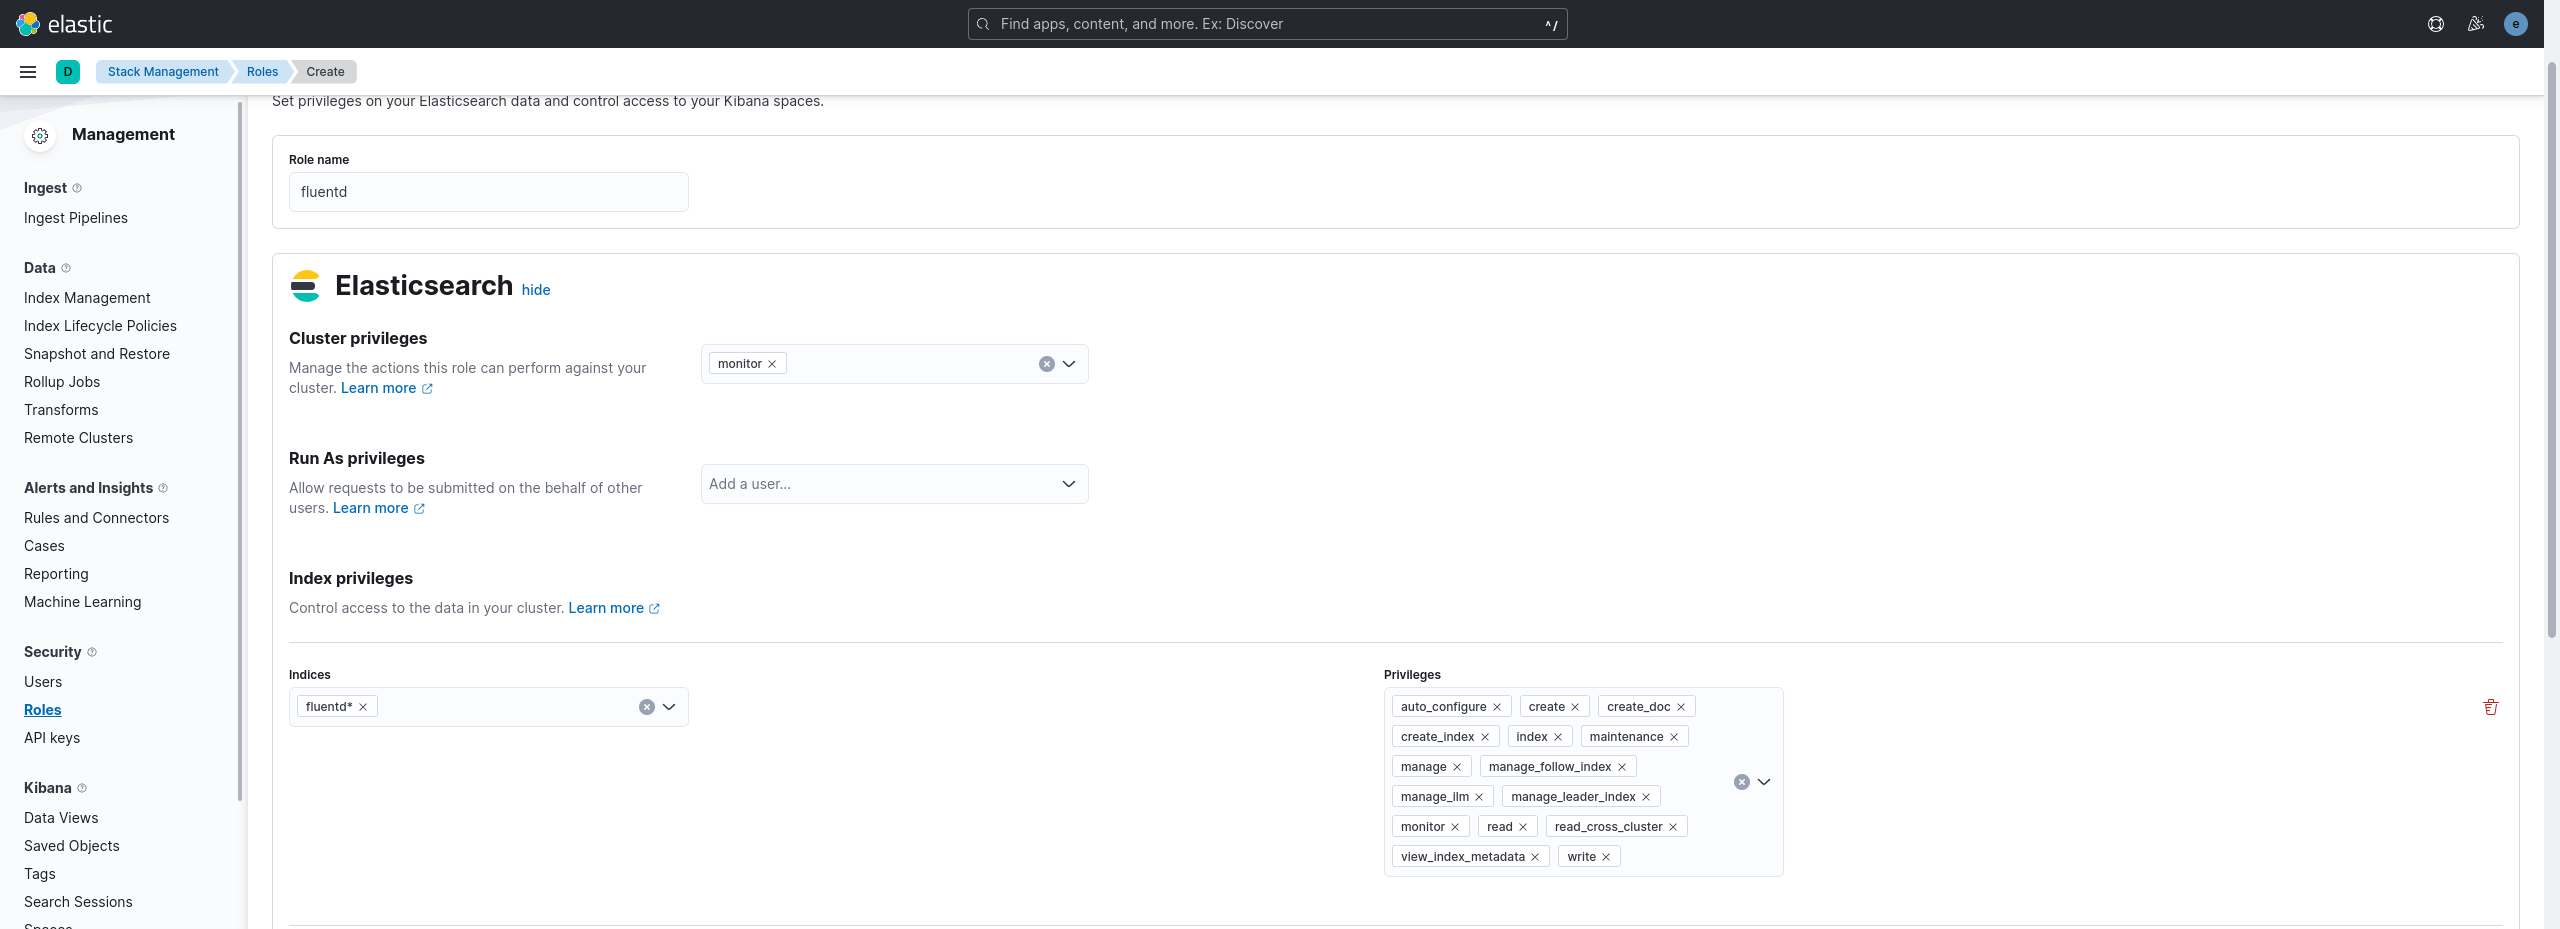
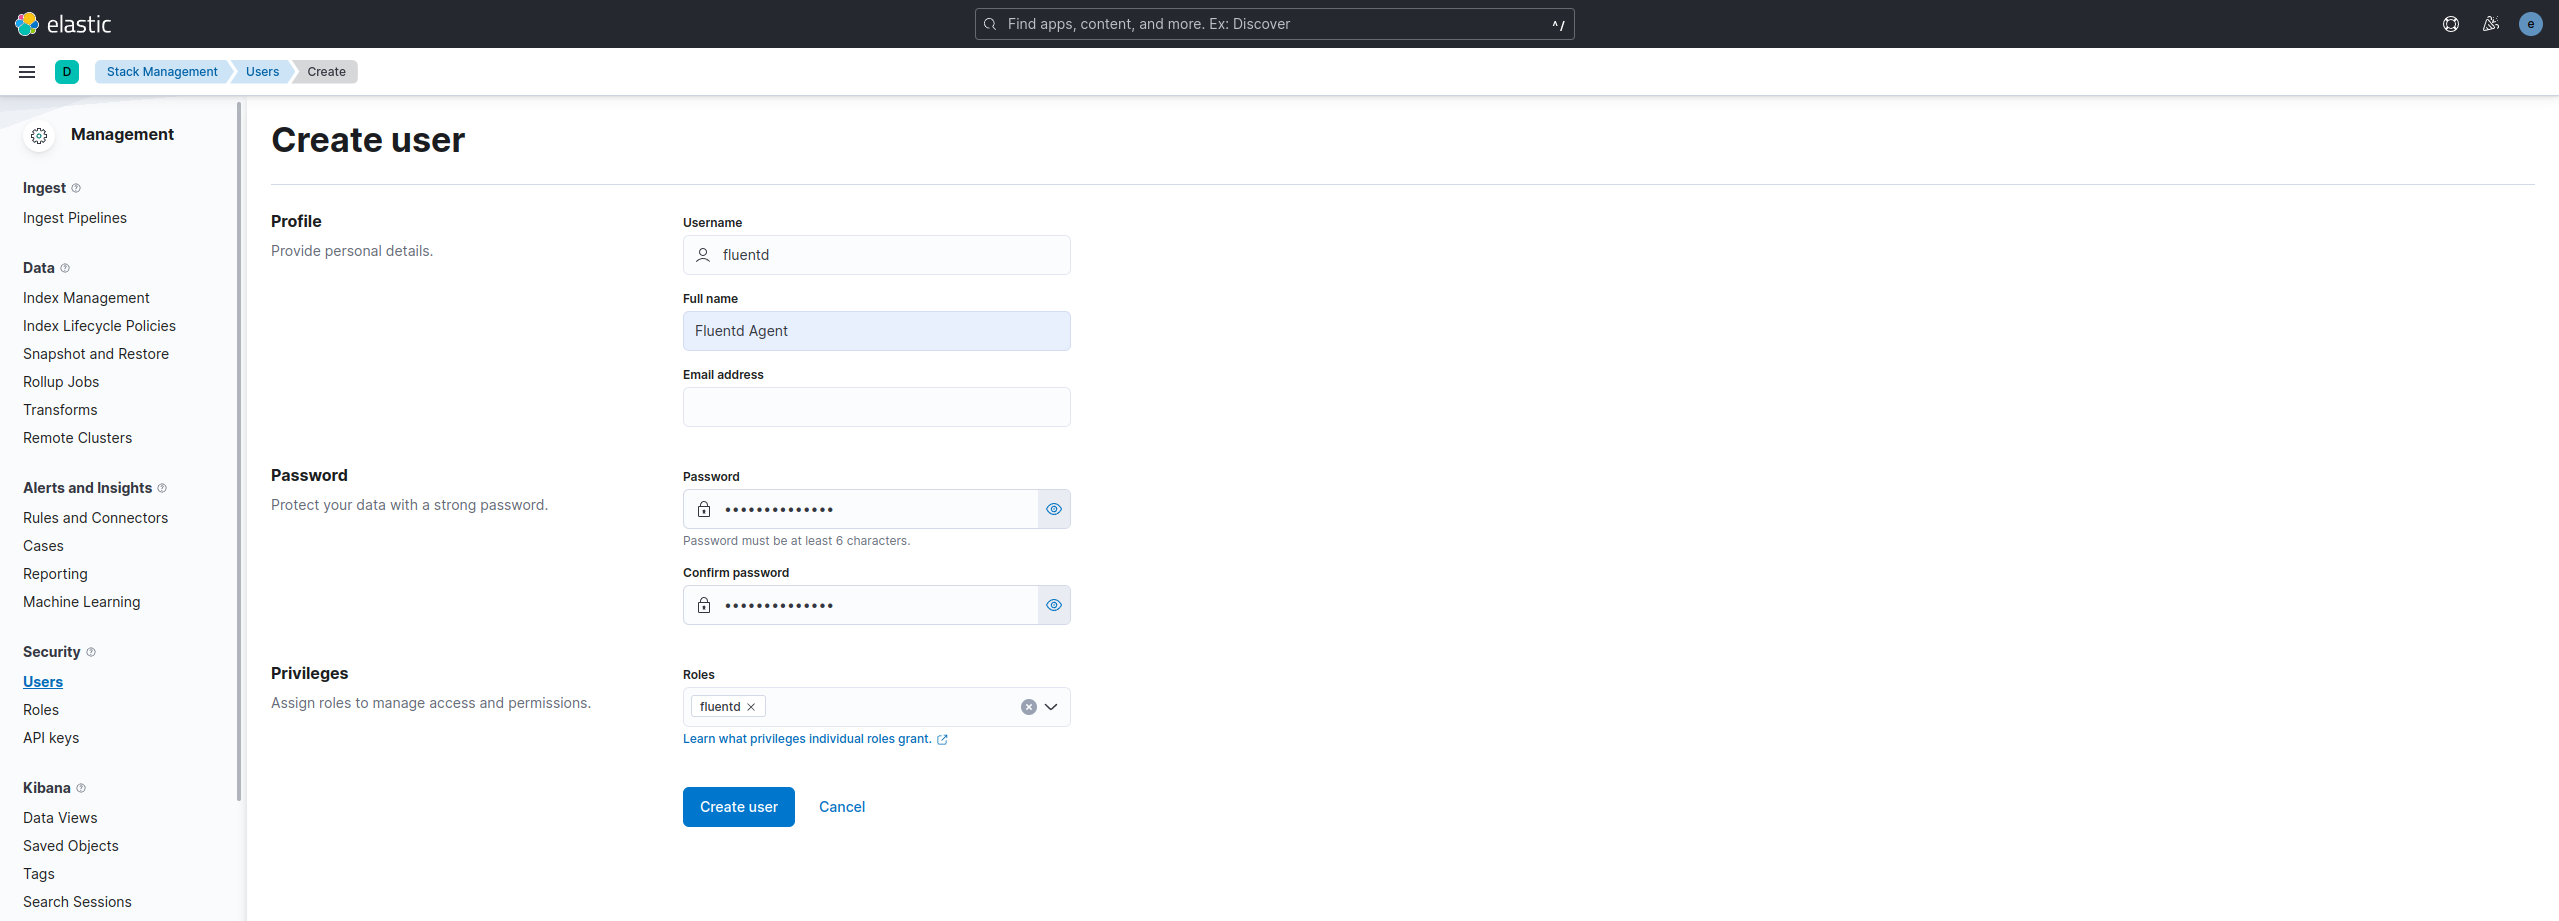
- Создаем самого пользователя fluentd, указываем пароль и выбираем созданную ранее роль fluentd:
Запускаем наш созданный контейнер:
Настройка JSON логов в Nginx
Чтобы писать логи в JSON достаточно добавить следущий формат в Nginx.
log_format main_json escape=json '{'
  '"msec": "$msec", ' # request unixtime in seconds with a milliseconds resolution
  '"connection": "$connection", ' # connection serial number
  '"connection_requests": "$connection_requests", ' # number of requests made in connection
  '"pid": "$pid", ' # process pid
  '"request_id": "$request_id", ' # the unique request id
  '"request_length": "$request_length", ' # request length (including headers and body)
  '"remote_addr": "$remote_addr", ' # client IP
  '"remote_user": "$remote_user", ' # client HTTP username
  '"remote_port": "$remote_port", ' # client port
  '"time_local": "$time_local", '
  '"time_iso8601": "$time_iso8601", ' # local time in the ISO 8601 standard format
  '"request": "$request", ' # full path no arguments if the request
  '"request_uri": "$request_uri", ' # full path and arguments if the request
  '"args": "$args", ' # args
  '"status": "$status", ' # response status code
  '"body_bytes_sent": "$body_bytes_sent", ' # the number of body bytes exclude headers sent to a client
  '"bytes_sent": "$bytes_sent", ' # the number of bytes sent to a client
  '"http_referer": "$http_referer", ' # HTTP referer
  '"http_user_agent": "$http_user_agent", ' # user agent
  '"http_x_forwarded_for": "$http_x_forwarded_for", ' # http_x_forwarded_for
  '"http_host": "$http_host", ' # the request Host: header
  '"server_name": "$server_name", ' # the name of the vhost serving the request
  '"request_time": "$request_time", ' # request processing time in seconds with msec resolution
  '"upstream": "$upstream_addr", ' # upstream backend server for proxied requests
  '"upstream_connect_time": "$upstream_connect_time", ' # upstream handshake time incl. TLS
  '"upstream_header_time": "$upstream_header_time", ' # time spent receiving upstream headers
  '"upstream_response_time": "$upstream_response_time", ' # time spend receiving upstream body
  '"upstream_response_length": "$upstream_response_length", ' # upstream response length
  '"upstream_cache_status": "$upstream_cache_status", ' # cache HIT/MISS where applicable
  '"ssl_protocol": "$ssl_protocol", ' # TLS protocol
  '"ssl_cipher": "$ssl_cipher", ' # TLS cipher
  '"scheme": "$scheme", ' # http or https
  '"request_method": "$request_method", ' # request method
  '"server_protocol": "$server_protocol", ' # request protocol, like HTTP/1.1 or HTTP/2.0
  '"pipe": "$pipe", ' # “p” if request was pipelined, “.” otherwise
  '"gzip_ratio": "$gzip_ratio", '
  '"http_cf_ray": "$http_cf_ray"'
'}';
Это самая "жирная" конфигурация логирования в JSON, которая мне попадалась. Её стоит положить в /etc/nginx/conf.d/logging.conf, а в основном файле /etc/nginx/nginx.conf стоит проверить наличие строк подключения:
Далее в нужном месте мы просто включаем логирование в формате main_json.access_log syslog:server=fluentd:5140,tag=nginx_access main_json;
error_log syslog:server=fluentd:5140,tag=nginx_error,severity=error;
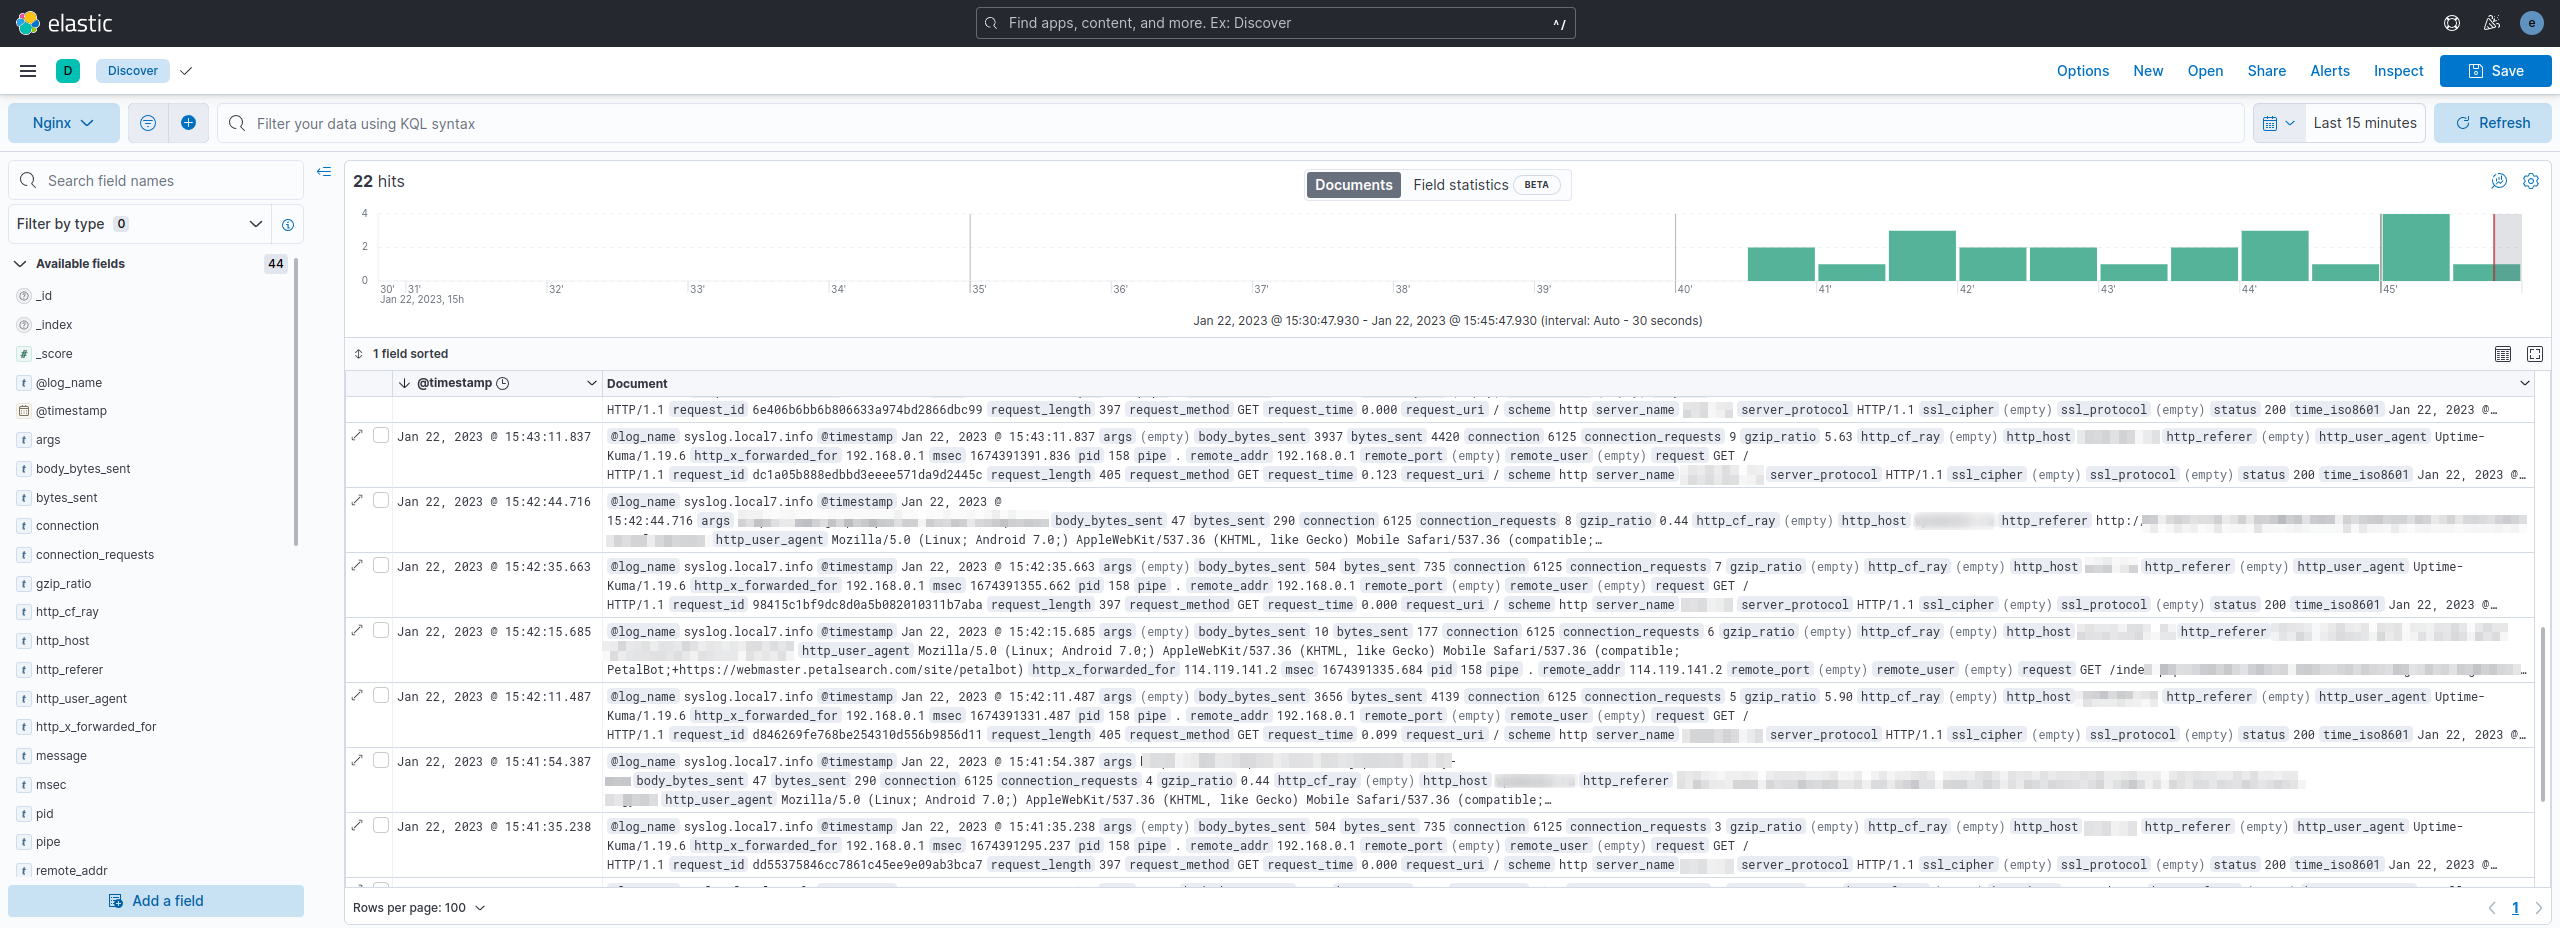
Теперь если всё правильно сделано, то должен появиться индекс fluentd 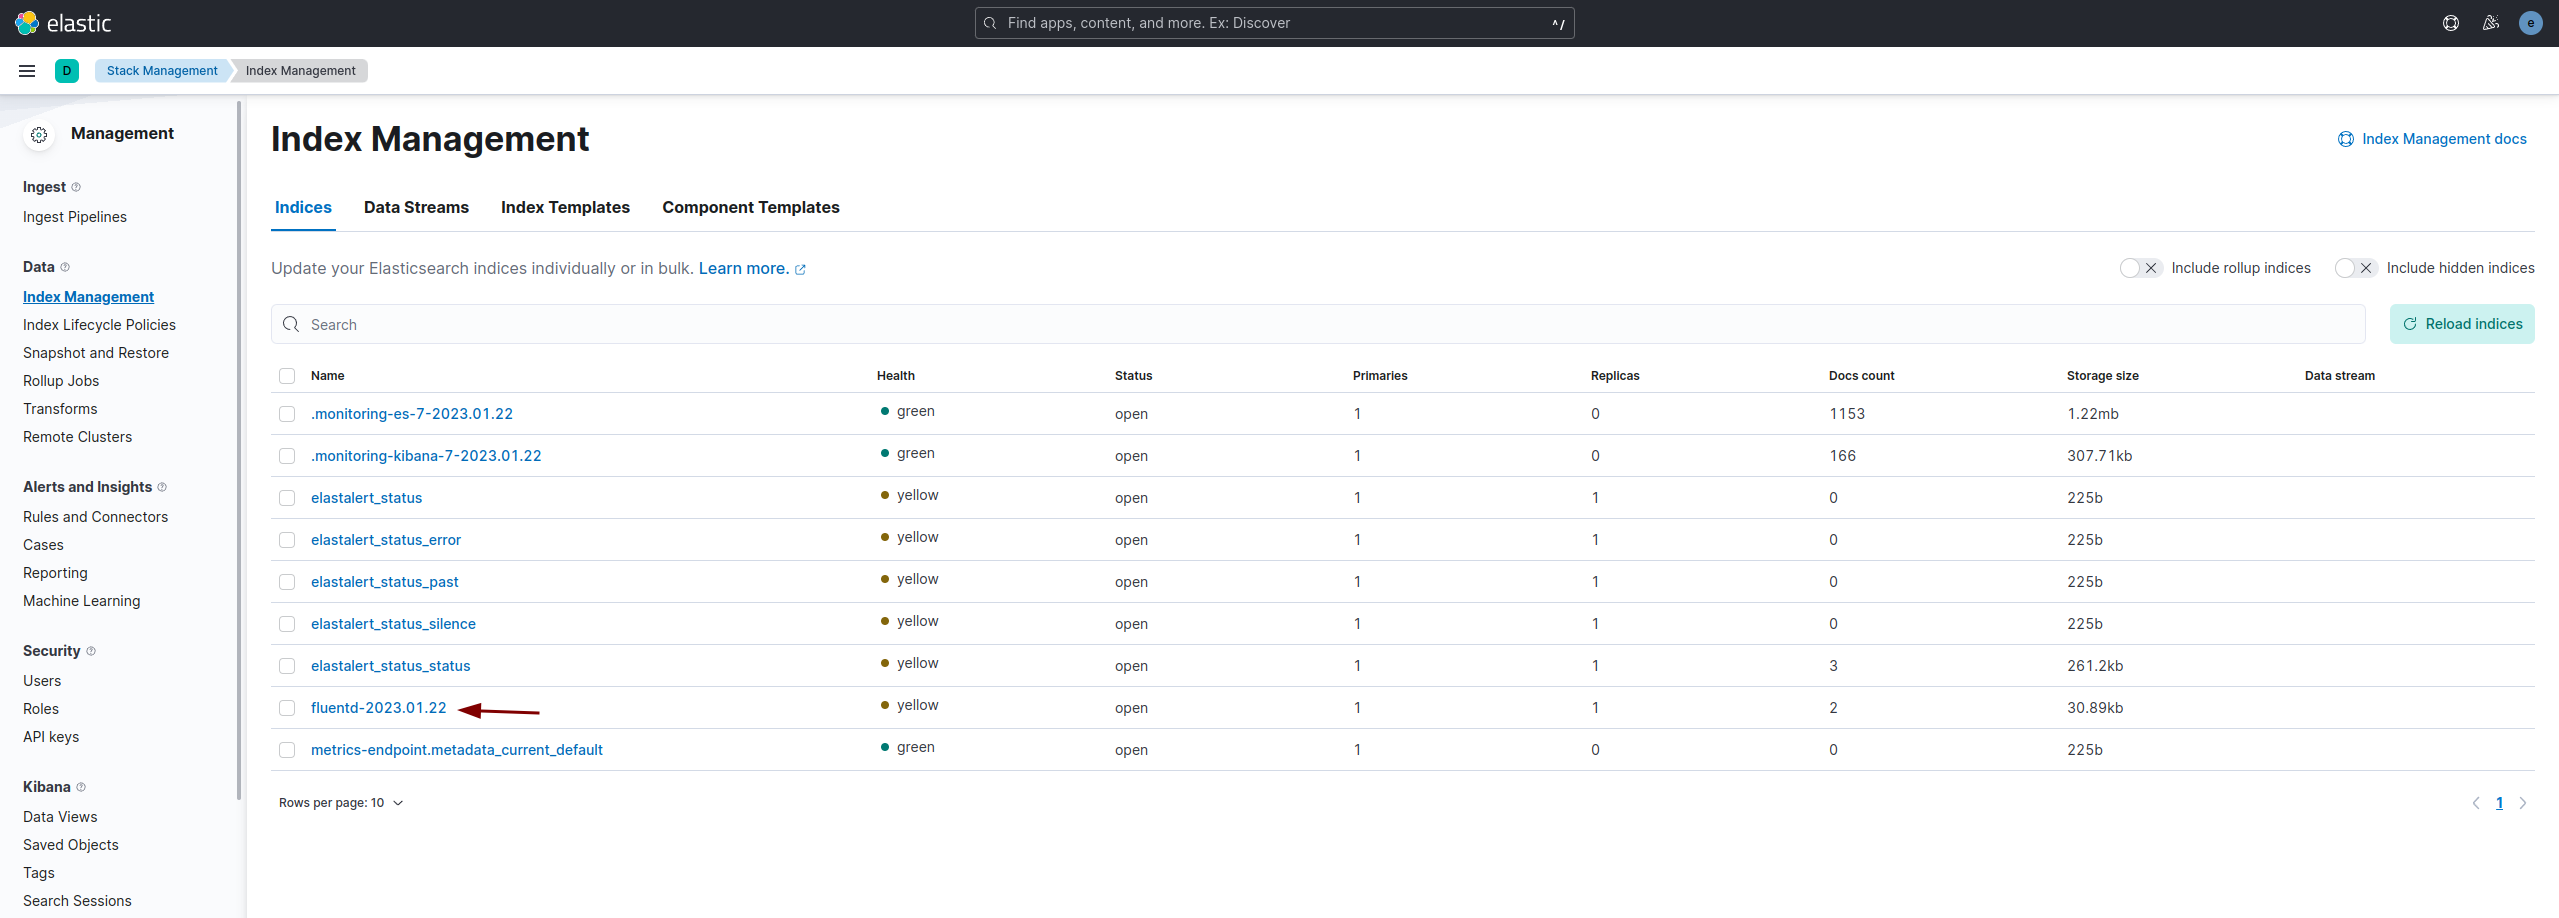
Настройка просмотра логов Nginx